Bokeh plot in Django and with REST and Flask
Last weeks I have working with a django app for research. I will update it when it will be ready ;-).
However, the introduction of Javascript and specifically Vue.js have produce that the website is mainly dynamic using JS and not Python. Also, we have done a static website http://www.tflsgo.org/ (using Gitlab Page and Jekyll), so I started considering to transform the website to a static website using Rest service with Python.
First, I was considering Django Rest Framework but finally I decided to use Flask-Restful by its simplicity (and Flask-SQLAlchemy for the communication with the database).
The problem with that was how to serve the Bokeh figures as Rest services. I starting reading websites and manual and searching but I didn’t get any satisfactory answer.
Hours later, I obtained the answer, so I am going to explain it to avoid the reader to waste his/her time.
Using django
First, the solution is the embed subpackage at https://bokeh.pydata.org/en/latest/docs/reference/embed.html. There are several options:
-
file_html: generate the html output, it is not useful for rest.
-
server_document: It requires a Bokeh server.
-
components: It returns a js script and a div to include.
-
autoload_static: It returns a js function and a div to include.
In the django layout, I used:
<html>
<head>
...
{% block bokeh_js %}{% endblock %}
</head>
<body>
...
{% block bokeh_fig %}{% endblock %}
</body>
</body>
In the template I done:
{% block bokeh_fig %}
{% for fig in bokeh_divs %}
<h2>{{fig.0}}</h2>
{{ fig.1 | safe}}
{% endfor %}
{% endblock %}
safe is required to allow the bokeh visualization, and fig is a dictionary. Using the default django template system, fig.0 refers to the key and fig.1 refers to the value.
When the views generate these variable by:
scripts, divs = components(figs)

return render(request, 'compare.html', {
   # ...
   'bokeh_script':  scripts,
   'bokeh_divs':  divs_sorted,
})
when figs is a dictionary with the different plot by figures. The idea was to visualize the plots with a title with the caption of each one of them.
Flask-Rest version
Although we could visualize using function components, for the Rest service it was not adequate.
In the html page, the bokeh and jquery are required:
<script src="https://code.jquery.com/jquery-3.2.1.min.js"></script>
<script src="http://cdn.pydata.org/bokeh/release/bokeh-0.12.13.min.js"></script>
<script src="http://cdn.pydata.org/bokeh/release/bokeh-widgets-0.12.13.min.js"></script>
<script src="http://cdn.pydata.org/bokeh/release/bokeh-tables-0.12.13.min.js"></script>
and a div in which the figure will be shown:
<body>
...
<div id="#fig"></div>
</body>
The complete file is:
<!doctype html>
<html>
    <head>
        <title>Test</title>
<script src="https://code.jquery.com/jquery-3.2.1.min.js"></script>
<script src="http://cdn.pydata.org/bokeh/release/bokeh-0.12.13.min.js"></script>
<script src="http://cdn.pydata.org/bokeh/release/bokeh-widgets-0.12.13.min.js"></script>
<script src="http://cdn.pydata.org/bokeh/release/bokeh-tables-0.12.13.min.js"></script>
        <meta charset="utf-8" />
    </head>
    <body>
        <h1>Test</h1>
        <div id="fig"></div>
        <script src="./run.js"></script>
    </body>
</html>
Then, the web apps include:
from flask import Flask
from flask_restful import Resource, Api
from flask_cors import CORS

from holoviews as hv
from bokeh.resources import CDN
from bokeh.embed import autoload_static

# Create the app
app = Flask(__name__)
# Initially I was the error Cross Origin Resource Sharing
# that allow all origin domains, not complete sure, only by demo
CORS(app)
# Restful
api = Api(app)

# Configurate  holoviews to create bokeh figures
hv.extension('bokeh')
renderer = hv.renderer('bokeh')

# An example of generation of bokeh
def get_plot():
    xs = range(-10,11)
    ys = [100+x**2 for x in xs]
    plot_hv = hv.Curve((xs, ys))
    plot = renderer.get_plot(plot_hv).state
    return plot

# Example
class Figure(Resource):
    def get(self):
        plot = get_plot()
        div, js = components(plot)
        js, tags = autoload_static(plot, CDN, "fig/")
       return {'js': js, 'tags': tags}

api.add_resource(Figure, '/fig')

if __name__ == '__main__':
    app.run()
The js variable is the javascript function to run the visualization of the Bokeh figure, and tags is the div in which the figure will be shown.
The final JS code is:
$.ajax({
    url: 'http://localhost:5000/fig',
    method: 'GET',
    success: function(data) {
        console.log(data);
        // First,  the div code is inserted
        $('#fig').replaceWith(data['tags']);
        // Later, the JS code must be evaluated
        eval(data['js']);
    },
});
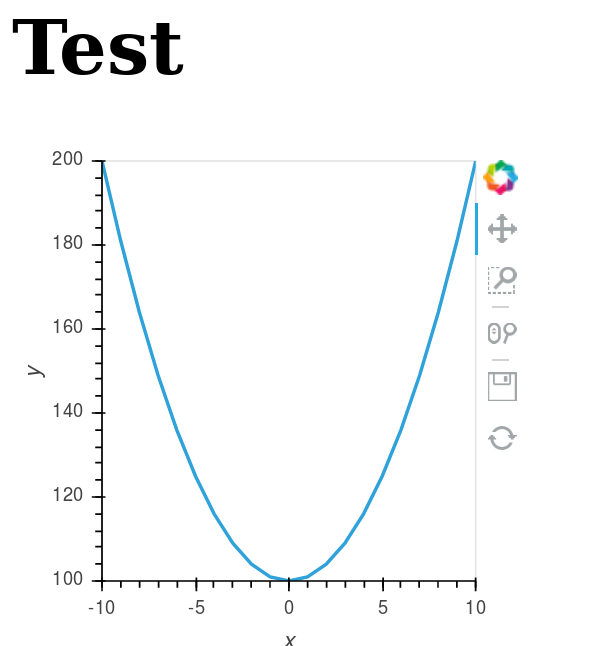
And the result is:
