Programming
DONE Bokeh plot in Django and with REST and Flask
Last weeks I have working with a django app for research. I will update it when it will be ready ;-).
However, the introduction of Javascript and specifically Vue.js have produce that the website is mainly dynamic using JS and not Python. Also, we have done a static website http://www.tflsgo.org/ (using Gitlab Page and Jekyll), so I started considering to transform the website to a static website using Rest service with Python.
First, I was considering Django Rest Framework but finally I decided to use Flask-Restful by its simplicity (and Flask-SQLAlchemy for the communication with the database).
The problem with that was how to serve the Bokeh figures as Rest services. I starting reading websites and manual and searching but I didn’t get any satisfactory answer.
Hours later, I obtained the answer, so I am going to explain it to avoid the reader to waste his/her time.
Using django
First, the solution is the embed subpackage at https://bokeh.pydata.org/en/latest/docs/reference/embed.html. There are several options:
- file_html
- generate the html output, it is not useful for rest.
- server_document
- It requires a Bokeh server.
- components
- It returns a js script and a div to include.
- autoload_static
- It returns a js function and a div to include.
In the django layout, I used:
<html>
<head>
...
{% block bokeh_js %}{% endblock %}
</head>
<body>
...
{% block bokeh_fig %}{% endblock %}
</body>
</body>
In the template I done:
{% block bokeh_fig %}
{% for fig in bokeh_divs %}
<h2>{{fig.0}}</h2>
{{ fig.1 | safe}}
{% endfor %}
{% endblock %}
safe is required to allow the bokeh visualization, and fig is a dictionary. Using the default django template system, fig.0 refers to the key and fig.1 refers to the value.
When the views generate these variable by:
scripts, divs = components(figs)

return render(request, 'compare.html', {
   # ...
   'bokeh_script':  scripts,
   'bokeh_divs':  divs_sorted,
})
when figs is a dictionary with the different plot by figures. The idea was to visualize the plots with a title with the caption of each one of them.
Flask-Rest version
Although we could visualize using function components, for the Rest service it was not adequate.
In the html page, the bokeh and jquery are required:
<script src="https://code.jquery.com/jquery-3.2.1.min.js"></script>
<script src="http://cdn.pydata.org/bokeh/release/bokeh-0.12.13.min.js"></script>
<script src="http://cdn.pydata.org/bokeh/release/bokeh-widgets-0.12.13.min.js"></script>
<script src="http://cdn.pydata.org/bokeh/release/bokeh-tables-0.12.13.min.js"></script>
and a div in which the figure will be shown:
<body>
...
<div id="#fig"></div>
</body>
The complete file is:
<!doctype html>
<html>
    <head>
        <title>Test</title>
<script src="https://code.jquery.com/jquery-3.2.1.min.js"></script>
<script src="http://cdn.pydata.org/bokeh/release/bokeh-0.12.13.min.js"></script>
<script src="http://cdn.pydata.org/bokeh/release/bokeh-widgets-0.12.13.min.js"></script>
<script src="http://cdn.pydata.org/bokeh/release/bokeh-tables-0.12.13.min.js"></script>
        <meta charset="utf-8" />
    </head>
    <body>
        <h1>Test</h1>
        <div id="fig"></div>
        <script src="./run.js"></script>
    </body>
</html>
Then, the web apps include:
from flask import Flask
from flask_restful import Resource, Api
from flask_cors import CORS
from holoviews as hv
from bokeh.resources import CDN
from bokeh.embed import autoload_static
# Create the app
app = Flask(__name__)
# Initially I was the error Cross Origin Resource Sharing
# that allow all origin domains, not complete sure, only by demo
CORS(app)
# Restful
api = Api(app)
# Configurate holoviews to create bokeh figures
hv.extension('bokeh')
renderer = hv.renderer('bokeh')
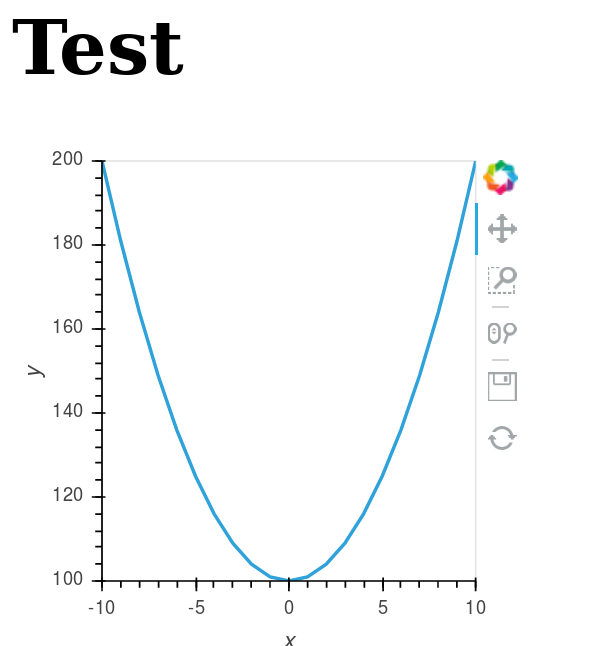
# An example of generation of bokeh
def get_plot():
xs = range(-10,11)
ys = [100+x**2 for x in xs]
plot_hv = hv.Curve((xs, ys))
plot = renderer.get_plot(plot_hv).state
return plot
# Example
class Figure(Resource):
def get(self):
plot = get_plot()
div, js = components(plot)
js, tags = autoload_static(plot, CDN, "fig/")
return {'js': js, 'tags': tags}
api.add_resource(Figure, '/fig')
if __name__ == '__main__':
app.run()
The js variable is the javascript function to run the visualization of the Bokeh figure, and tags is the div in which the figure will be shown.
The final JS code is:
$.ajax({
    url: 'http://localhost:5000/fig',
    method: 'GET',
    success: function(data) {
        console.log(data);
        // First,  the div code is inserted
        $('#fig').replaceWith(data['tags']);
        // Later, the JS code must be evaluated
        eval(data['js']);
    },
});
And the result is:
DONE Improving performance in Python
All the source code of this post is available at github.
In the previous post, I recognized my predilection for Python. For me, it is a great language for create prototypes in many areas. For my research work, I usually creates/designs algorithms for continuous optimization using evolutionary algorithms. For these algorithms, languages like C/C++ or Java are widely used, specially for its good performance (to publish, it is usual to have to make many comparisons between algorithms, so the performance could be critical. However, for testing new ideas, many authors uses other tools like Mathlab that reduces the developer time at the cost of a higher computing time.
I agree that Mathlab is great for numerical algorithms, but I still prefer Python over Mathlab, because I’m more confortable with it, and have many libraries, and it’s more simpler to call code in other languages, written in C or Java. That allow us to increase the performance, and I like to test how much it could be improved.
Several months ago, I start writing my most succesful algorithm, Memetic Algorithms based on LS Chaining, in Python. I had several doubts about the performance, so I start writing one element, an Steady-State Genetic Algorithm, in Python.
Calling C/C++ code from python
The first challenge I had to tackle was to allow my python program to use the same benchmark functions than other implementations, CEC'2005 benchmark. This benchmark define the functions to optimize, thus its main funtionality is evaluate my solutions, when each solution is a vector of real numbers, with a real fitness value. The benchmark code was implemented (by its authors) in C/C++. So, my python code have to call C++ code.
For doing that, I used the library boost::python, that is, in my opinion, the simpler way to call C/C++ code, specially when we uses numpy package.
In my case, it is very simple, because I need few functions:
#include <boost/python.hpp>
#include <boost/python/numeric.hpp>
#include <boost/python/list.hpp>
#include <iostream>
#include "cec2005/cec2005.h"
#include "cec2005/srandom.h"

using namespace boost::python;

Random r(new SRandom(12345679));

void set_function(int fun, int dim) {
    init_cec2005(&r, fun, dim);
}

double evalua(const numeric::array &el) {
   const tuple &shape = extract<tuple>(el.attr("shape"));
   unsigned n = boost::python::extract<unsigned>(shape[0]);
   double *tmp = new double[n];
  for(unsigned int i = 0; i < n; i++)
    {
      tmp[i] = boost::python::extract<double>(el[i]);
    }
  double result = eval_cec2005(tmp, n);
  delete tmp;
  return result;
}
...

BOOST_PYTHON_MODULE(libpycec2005)
{
    using namespace boost::python;
    numeric::array::set_module_and_type( "numpy", "ndarray");
    def("config", &set_function);
    def("evaluate", &evalua);
    ...
}
More info in the good boost::python documentation.
One we can call C/C++ code, we have implemented the algorithm in python code. The test code was the following:
from ssga import SSGA
from readargs import ArgsCEC05
import libpycec2005 as cec2005
import numpy

def check_dimension(option, opt, value):
    if value not in [2, 10, 30, 50]:
        raise OptionValueError(
            "option %s: invalid dimensionality value: %r" % (opt, value))

def main():
    """
    Main program
    """
    args = ArgsCEC05()

    if  args.hasError:
        args.print_help_exit()

    fun = args.function
    dim = args.dimension

    print "Function: %d" %fun
    print "Dimension: %d" %dim
    cec2005.config(fun, dim)
    domain = cec2005.domain(fun)
    print "Domain: ", domain
    ea = SSGA(domain=domain, size=60, dim=dim, fitness=cec2005.evaluate)

    for x in xrange(25):
        ea.run(maxeval=dim*10000)
        [bestsol, bestfit] = ea.getBest()
        print "BestSol: ", bestsol
        print "BestFitness: %e" %bestfit
        ea.reset()

if __name__ == "__main__":
    main()
This source code run the algorithm 25 times, and in each run the algorithm stops when they are created 10000*dim solutions. These conditions are indicated in the benchmark specification. The only parameter was the function (-f, used function 1 by default) and dimension (-d) from 10, 30, 50.
Profiling the computing time
How much time it takes? I have changed xrange(25) for xrange(1) and we have run its current version. The final time was 7 minutes for dimension 10, and 21 minutes for dimension 30 (for only one function).
Because I like to make more interesting things, that only waiting computing time, I use the profile, only one run for the function, to detect the functions/method more expensive in computing time.
python -m cProfile runcec.py -f 1 -d 10
The output was the following:
        2943600 function calls (2943531 primitive calls) in 31.031 seconds

   Ordered by: standard name

   ncalls  tottime  percall  cumtime  percall filename:lineno(function)
....
      1    0.001    0.001    0.126    0.126 ssga.py:1(<module>)
    99940    0.561    0.000   17.463    0.000 ssga.py:109(cross)
        1    0.000    0.000    0.000    0.000 ssga.py:123(reset)
        1    5.559    5.559   51.129   51.129 ssga.py:126(run)
        1    0.000    0.000    0.000    0.000 ssga.py:14(__init__)
        1    0.000    0.000    0.000    0.000 ssga.py:158(getBest)
        1    0.000    0.000    0.000    0.000 ssga.py:31(set_mutation_rate)
    99940    0.730    0.000    1.885    0.000 ssga.py:45(mutation)
    12438    0.286    0.000    0.758    0.000 ssga.py:50(mutationBGA)
        1    0.002    0.002    0.002    0.002 ssga.py:77(initPopulation)
   105883    1.101    0.000    5.604    0.000 ssga.py:89(updateWorst)
        1    0.000    0.000    0.000    0.000 ssga.py:9(SSGA)
    99940    1.049    0.000   20.617    0.000 ssga.py:97(getParents)
...
With the profile we can observe the most expensive methods in our code: getParents (20 seconds), crossover operator (17 seconds), and updateWorst (5 seconds). These methods are the 85% of the computing time, and the first two methods the 74% of the computing time.
Optimising the code
That proves the majority of computing time is due to a minority of the code, only three methods. If we can optimize these methods, our code could be improved a lot.
We can uses again the boost::python package, but it’s a bit tedious to use it. So, we have used the cython package. With cython we can optimize the source code adding information about the types.
For instead, Instead of the following code:
import numpy as np

def distance(ind1,ind2):
    """
    Euclidean distance
    ind1 -- first array to compare
    ind2 -- second array to compare

    Return euclidean distance between the individuals

    >>> from numpy.random import rand
    >>> import numpy as np
    >>> dim = 30
    >>> sol = rand(dim)
    >>> distance(sol,sol)
    0.0
    >>> ref=np.zeros(dim)
    >>> dist=distance(sol,ref)
    >>> dist > 0
    True
    >>> dist2 = distance(sol*2,ref)
    >>> 2*dist == dist2
    True
    """
    dif = ind1-ind2
    sum = (dif*dif).sum()
    return math.sqrt(sum)
we can write:
cimport numpy as np
cimport cython
DTYPE = np.double
ctypedef np.double_t DTYPE_t
ctypedef np.int_t BTYPE_t

def distance(np.ndarray[DTYPE_t, ndim=1]ind1, np.ndarray[DTYPE_t, ndim=1] ind2):
    """
    Euclidean distance
    ind1 -- first array to compare
    ind2 -- second array to compare

    ....
    """
    cdef np.ndarray[DTYPE_t, ndim=1] dif = ind1-ind2
    cdef double sum = (dif*dif).sum()
    return math.sqrt(sum)
We can see that is still very readable. we only have put information about the type and dimension in the vector parameters and about the variables, using the keyword cdef.
Let’s see as an example the first method, the crossover operator, implemented in the crossBLX method:
import numpy as np
import math

def crossBLX(mother,parent,domain,alpha):
    """
    crossover operator BLX-alpha

    mother -- mother (first individual)
    parent -- parent (second individual)
    domain -- domain to check
    alpha  -- parameter alpha

    Returns the new children following the expression children = random(x-alpha*dif, y+alpha*dif),
                where dif=abs(x,y) and x=lower(mother,parents), y=upper(mother,parents)

    >>> import numpy as np
    >>> low=-5
    >>> upper = 5
    >>> dim=30
    >>> sol = np.array([1,2,3,2,1])
    >>> crossBLX(sol,sol,[low,upper],0)
    array([ 1.,  2.,  3.,  2.,  1.])
    """
    diff = abs(mother-parent)
    dim = mother.size
    I=diff*alpha
    points = np.array([mother,parent])
    A=np.amin(points,axis=0)-I
    B=np.amax(points,axis=0)+I
    children = np.random.uniform(A,B,dim)
    [low,high]=domain
    return np.clip(children, low, high)
We can see that it is very simple to implement using numpy, but it is still very slow. With cython I have defined directly implement the many operations, the following code:
def crossBLX(np.ndarray[DTYPE_t, ndim=1] mother,np.ndarray[DTYPE_t, ndim=1] parent,list domain, double alpha):
    """
    ...
    """
    cdef np.ndarray[DTYPE_t, ndim=1] C, r
    cdef int low, high, dim
    cdef double x, y
    cdef double I, A, B
    cdef unsigned i
    [low,high]=domain
    dim = mother.shape[0]
    C = np.zeros(dim)
    r = random.randreal(0,1,dim)

    for i in range(dim):
        if mother[i] < parent[i]:
           (x,y) = (mother[i],parent[i])
        else:
           (y,x) = (mother[i],parent[i])

        I = alpha*(y-x)
        A=x-I
        B=y+I

        if (A < low):
            A = low
        if (B > high):
            B = high

        C[i] = A+r[i]*(B-A)

    return C
It’s true that the source code is more complicated, but it is still very readable. I have compared the two implementation to make sure both return the same values.
Measuring the improvement
How much these small changes in the code? I have profile the source code again and it gives me:
         1020045 function calls (1019976 primitive calls) in 18.003 seconds

   Ordered by: standard name

   ncalls  tottime  percall  cumtime  percall filename:lineno(function)
....
        1    0.001    0.001    0.127    0.127 ssga.py:1(<module>)
    99940    0.425    0.000    2.432    0.000 ssga.py:109(cross)
        1    0.000    0.000    0.000    0.000 ssga.py:123(reset)
        1    5.415    5.415   17.864   17.864 ssga.py:126(run)
        1    0.000    0.000    0.000    0.000 ssga.py:14(__init__)
        1    0.000    0.000    0.000    0.000 ssga.py:158(getBest)
        1    0.000    0.000    0.000    0.000 ssga.py:31(set_mutation_rate)
    99940    0.699    0.000    2.006    0.000 ssga.py:45(mutation)
    12544    0.338    0.000    0.929    0.000 ssga.py:50(mutationBGA)
        1    0.002    0.002    0.002    0.002 ssga.py:77(initPopulation)
   105959    0.775    0.000    1.343    0.000 ssga.py:89(updateWorst)
        1    0.000    0.000    0.000    0.000 ssga.py:9(SSGA)
    99940    0.940    0.000    6.665    0.000 ssga.py:97(getParents)
....
We can see the improvement obtained.
| Method | Python | Cython |
|---|---|---|
| cross : | 17.4 | 2.4 |
| getParents : | 20.6 | 6.6 |
| updateWorst : | 5.6 | 1.3 |
| Total | 43.6 | 10.3 |
The new code takes only a 23% of the computing time of the previous code. With these changes, we have reduced the total time from 51 seconds to 18 code.
In perspective
Now, I run the source code without the profile, and test the source code obtaining the following time:
| Method | dim=10 | dim=30 | dim=50 |
|---|---|---|---|
| Python | 44s | 3240s (54m) | – |
| Cython | 10s | 28s | 48s |
| Improvement | 77% | 99% | — |
In the following table, we test the maximum time for one and 25 runs (the time depends on the function used).
| #functions | dim=10 | dim=30 | dim=50 |
|---|---|---|---|
| 1 | 10s/18s | 28s/40s | 48s/1m |
| 25 | 3/7m | 15/21m | 38m/ |
So, the total computing time is 7 minutes for dimension 10, and 21 minutes for dimension 30. These numbers are very acceptable, specially because we can test in parallel the different functions in a cluster of computers. Unfortunately, an implementation in Mathlab not only take more time, but also, for licensing reasons, it could not run in parallel without limit.
In resume, we can uses python code, not only to create experimental prototypes, but also to create functional prototypes.
And about the possible testing problem, I’ve been working on it, but I think it is enough for a post, didn’t it? :-)
All the code refered in the post, both in python and cython, is available at github, if you want to see it.
DONE Callback that stop algorithm in R
Today I was making a little programming using the mathematical software R (very useful for statistics, by the way), for a little test.
I’m one of the authors of a Cran package (Rmalschains) for continuous optimization, and I was testing another packages to compare results.
Comparing a particular package I realise that the API doesn’t give me enough control for the comparisons. Briefly, to compare different algorithms all of them should stop when the same number of solutions is achieved. Unfortunately, for the DE package, the stopping criterion is the maximum iterations number, and for one strategy (the default strategy) this number differs, maintaining the same maximum iterations number, in function of the function to improve. I know, not so briefly :-).
In resume, I want to pass a function to evaluate solutions to an algorithm, and that only the first maxEvals solutions could be considered. So, it should be nice that after maxEvals function evaluations the algorithm will stop.
The aim is very simple in a theorical way, but I have only the control over a callback function used by the algorithm, and I cannot use an ‘exit’ function into the function, because in that case will stop the global program, not only the current state of the algorithm.
The solution? Using these ‘complex’ concepts that many people think that are useless, specially my CS students :-). Combining a call with continuation with a closure:
finalFitness = callCC (function(exitFitness) {
     fitnessCheck <- function(fn, maxevals) {
          function(x) {

               if (total == 0 || total < maxevals) {
                  total <<- total +1;
                  fitness = fn(x);

                  if (total == 1 || fitness < bestFitness) {
                     bestFitness <<- fitness;
                  }

               }

               if (total >= maxevals) {
                  exitFitness(bestFitness);
               }


               fitness;
           }

      }


      fitCheck = fitnessCheck(fun$fitness, fun$maxevals)

      log <- capture.output({
          total <- 0
          result=DEoptim(fitCheck, lower, upper, control=list(itermax=fun$maxevals/NP))
      })

      exitFitness(result$optim$bestval)
})
I know, it is a bit confusing. callCC implement the concept of call-with-current-continuation to run a code with an exit function exitFitness that allows me to stop the run of the algorithm. Because the function only does a run of the algorithm (DEOptim), I can stop when I want. Also, to make it more elegant, I use a closure fitnessCheck that receives a function and a maximum number of call, and it stops when the maximum calls number is achieved (total and bestFitness are global variable, so the way to modify their values is using <<- instead of the classical <- or =).
By the way, capture.output is a function that disables all the output of DEoptim algorithm.
DONE Property-Based Testing
Today I was reviewing a paper that I am doing in collaboration with other colleagues, a Phd student living in Sweden (in Västerås, a lovely city at a hour from Stockholm, I had a stay for 3 months three years ago). Then, to be sure that the proposed algorithm, a memetic version of a Differential Evolution, I started to implement it.
During the code, I need to create group of random variables, without repetition.
it could be generated in the following way:
for i in range(popsize):
    r1[i] = np.random.rand...
    r2[i] = np.random.rand...

    while r1[i] == r2[i]:
        r2[i] = np.random.rand...
However, it is not practical, for Matlab/Numpy it is better to work as vectors:
r1 = np.random.choice(popsize, popsize)
r2 = np.random.choice(popsize, popsize)
# Avoid repeated values
r2 = change_repeated(r2, r1, popsize)
I need change_repeated to randomly generated again the values in r2 when it is equals than r1 (in the same position).
Then, I create the function:
def change_repeated(values, original, maxvalue: int):
    """
    Repeat the values which are equals than original (position by position)

    :param values: array vector
    :param original: array vector or elements to not repeat
    :param maxvalue: maximum value (new ones will be between [0,  maxvalue])
    :returns: list of new values
    :rtype: ndarray.

    """
    equals, = np.nonzero(values == original)

    while len(equals) > 0:
        size = len(equals)
        values[equals] = np.random.choice(maxvalue, size)
        equals, = np.nonzero(values == original)

    return values
Great! Now, how I could test it? It could give several examples, and test again them. However, this type of tests can be very boring, so I applied Property-based testing.
In this type of tests, instead of comparing examples of inputs and outputs, you test properties that the function should follow for every possible input.
For instance, if you have implemented sqrt function:
- Traditional testing
- Check sqrt(25)==5, sqrt(16)==4, sqrt(9)==3, sqrt(5)=2.23….
- Property-based testing
- Check that the result of sqrt multiply for itself gives the original number.
When you are using property-based testing, you can use a particular library to automatically run your test with random inputs (with some constraints) hundreds of times. There are many tools for this: from the original QuickCheck, ScalaCheck for Scala, or Hypothesis for Python. In our case, we are using the simple Hypothesis, that it is very well-documented.
In our case, the properties of repeated(ys, xs) are:
- when xs and ys have some variable in common:
-
repeated(ys, xs) must be different than ys.
-
the result must be different than original vector (to avoid to modify the original one).
-
The indexes where ys and repeated(ys, xs) are different xs == ys.
-
The testing was done in the following way:
First the import:
from hypothesis import given
import hypothesis.strategies as st
import numpy as np
- Then, we describe the range of float values:
type_index = st.integers(min_value=0, max_value=popsize)
In that way, type_index create random values between [0, popsize-1]
Then, we define the input as a list of previous integers:
type_list = st.lists(type_index, min_size=popsize, max_size=popsize)
We have set the min_size and max_size equals to get lists with the same size. Hypothesis works by default with lists of different sizes.
Then, we say the type of each parameter:
@given(type_list, type_list)
def test_random_norepeat(x, y):
    xs = np.array(x)
    ys_orig = np.array(y)
    ys = np.copy(ys_orig)

    if np.any(xs == ys):
        ys = change_repeated(ys, xs, dim)
        # It cannot be any repeated element
        assert not np.any(xs == ys)
        # It can be change any  algorithm
        assert not np.all(ys == ys_orig)
        # The change must be justify
        assert np.all((ys == ys_orig) | (ys_orig == xs))
        # Check that all values are between [0, dim]
        assert np.all((ys >= 0) & (ys < dim))
When it is run with py.test the hypothesis library will test the function with hundreds of random xs and ys, when xs and ys are lists of size popsize and the values between [0, popsize). If it fails, it will show you the xs and ys values for which the code fails the test, it is very useful.
By the way, the original DE can be implemented like:
# Init population
pop = pop_init(popsize, dim, min=min_value, max=max_value)
fit = np.array([eval(sol) for sol in pop])
nevals = 0

while nevals <= maxevals:
    # Generate all random positions
    r1 = np.random.choice(popsize, popsize)
    r2 = np.random.choice(popsize, popsize)
    r3 = np.random.choice(popsize, popsize)
    # Avoid repeated values
    r2 = change_repeated(r2, r1, popsize)
    r3 = change_repeated_list(r3, [r1, r2], popsize)
    # New population, mutation
    V = pop[r1] + F*(pop[r2]-pop[r3])
    # Clipping
    V = np.clip(V, min_value, max_value)
    # Define U
    U = np.copy(pop)
    # Select cr
    cr = np.random.rand(popsize*dim).reshape((popsize, dim))
    # Make sure that for each individual a position is changed
    cr[np.arange(popsize), np.random.choice(dim, popsize)] = 0
    # Eq. 2 (crossover)
    U.flat[cr.flat < CR] = V.flat
    fitU = [eval(sol) for sol in U]
    nevals += popsize
    # Replacement
    better_cond = fitU < fit
    # Expand for dimension
    better_cond = np.repeat(better_cond, dim).reshape((popsize, dim))
    # Replace the best individual in population
    pop = np.where(better_cond, U, pop)
    fit = np.minimum(fit, fitU)
I have to organize it a little, but in only 35 lines (including comments) a complete Differential Evolution can be implemented. Numpy is awesome!
DONE Introduction to Julia
The last year I have been working in a promising programming language, Julia.
Even I have done a presentation focused on people with Computer Science background (so the talk compares Julia against Python),

Also it was given in Spanish

The resources of that talk are available at Github Repository.
Emacs
DONE Elfeed: Using emacs for reading RSS
In last years I have been using Emacs for almost all my daily tasks:
- Reading my emails (using mu4e).
- Creating the slides for my courses using org-beamer.
- Using dired to navigate for the file system).
- Publishing this blog (using Hugo and ox-hugo).
The last thing to integrate into emacs is reading blogs and news from RSS files. Adding elfeed and elfeed-org I was able to create RSS. elfeed-org is very simple, it allows to add the feeds as items in org-mode:
- Blogs                                                              :elfeed:

  - https://www.meneame.net/rss                                  :news:portada:
  - https://www.meneame.net/rss?status=queued                            :news:
  - http://planet.emacsen.org/atom.xml                                :emacs:
  - https://www.reddit.com/r/programming/.rss                     :programming:
  ...
The tags for each feed will be shared for all articles.
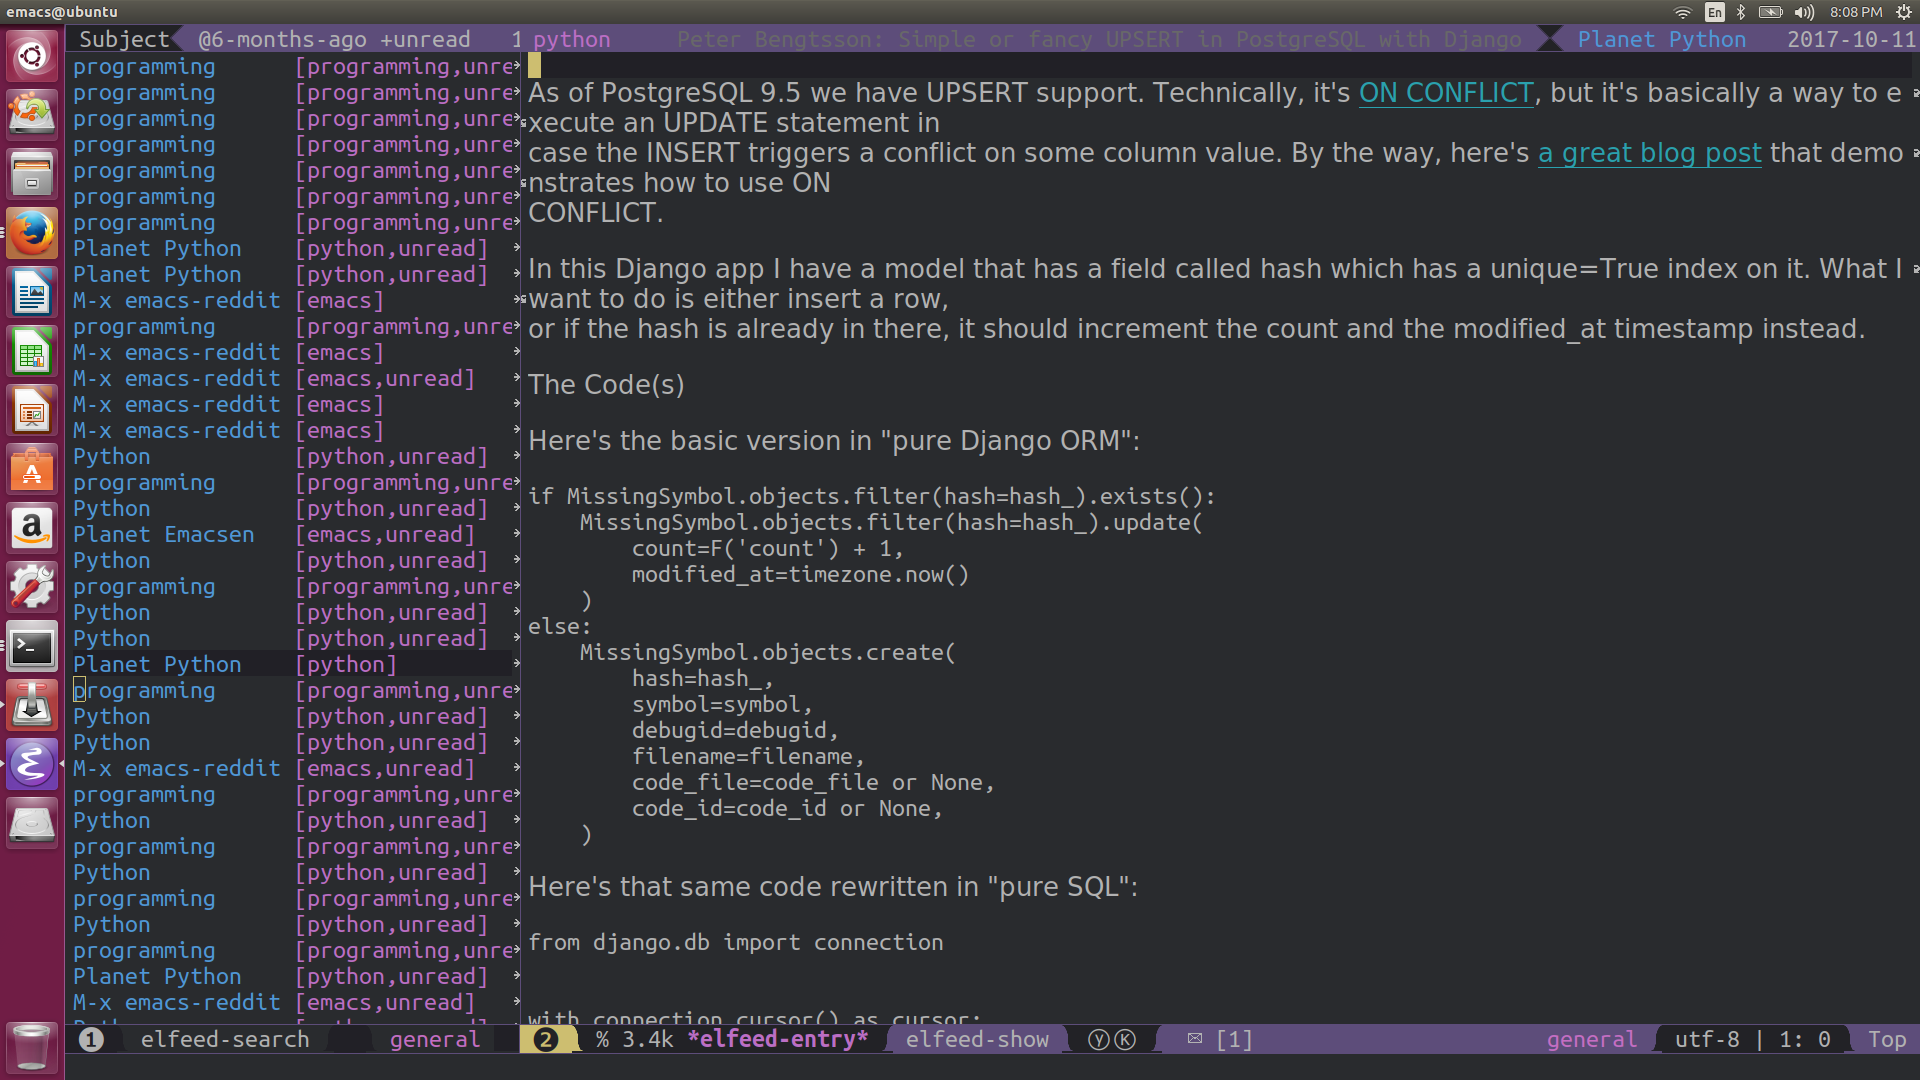
Then, loading elfeed, it can be obtained a screen showing the different articles:
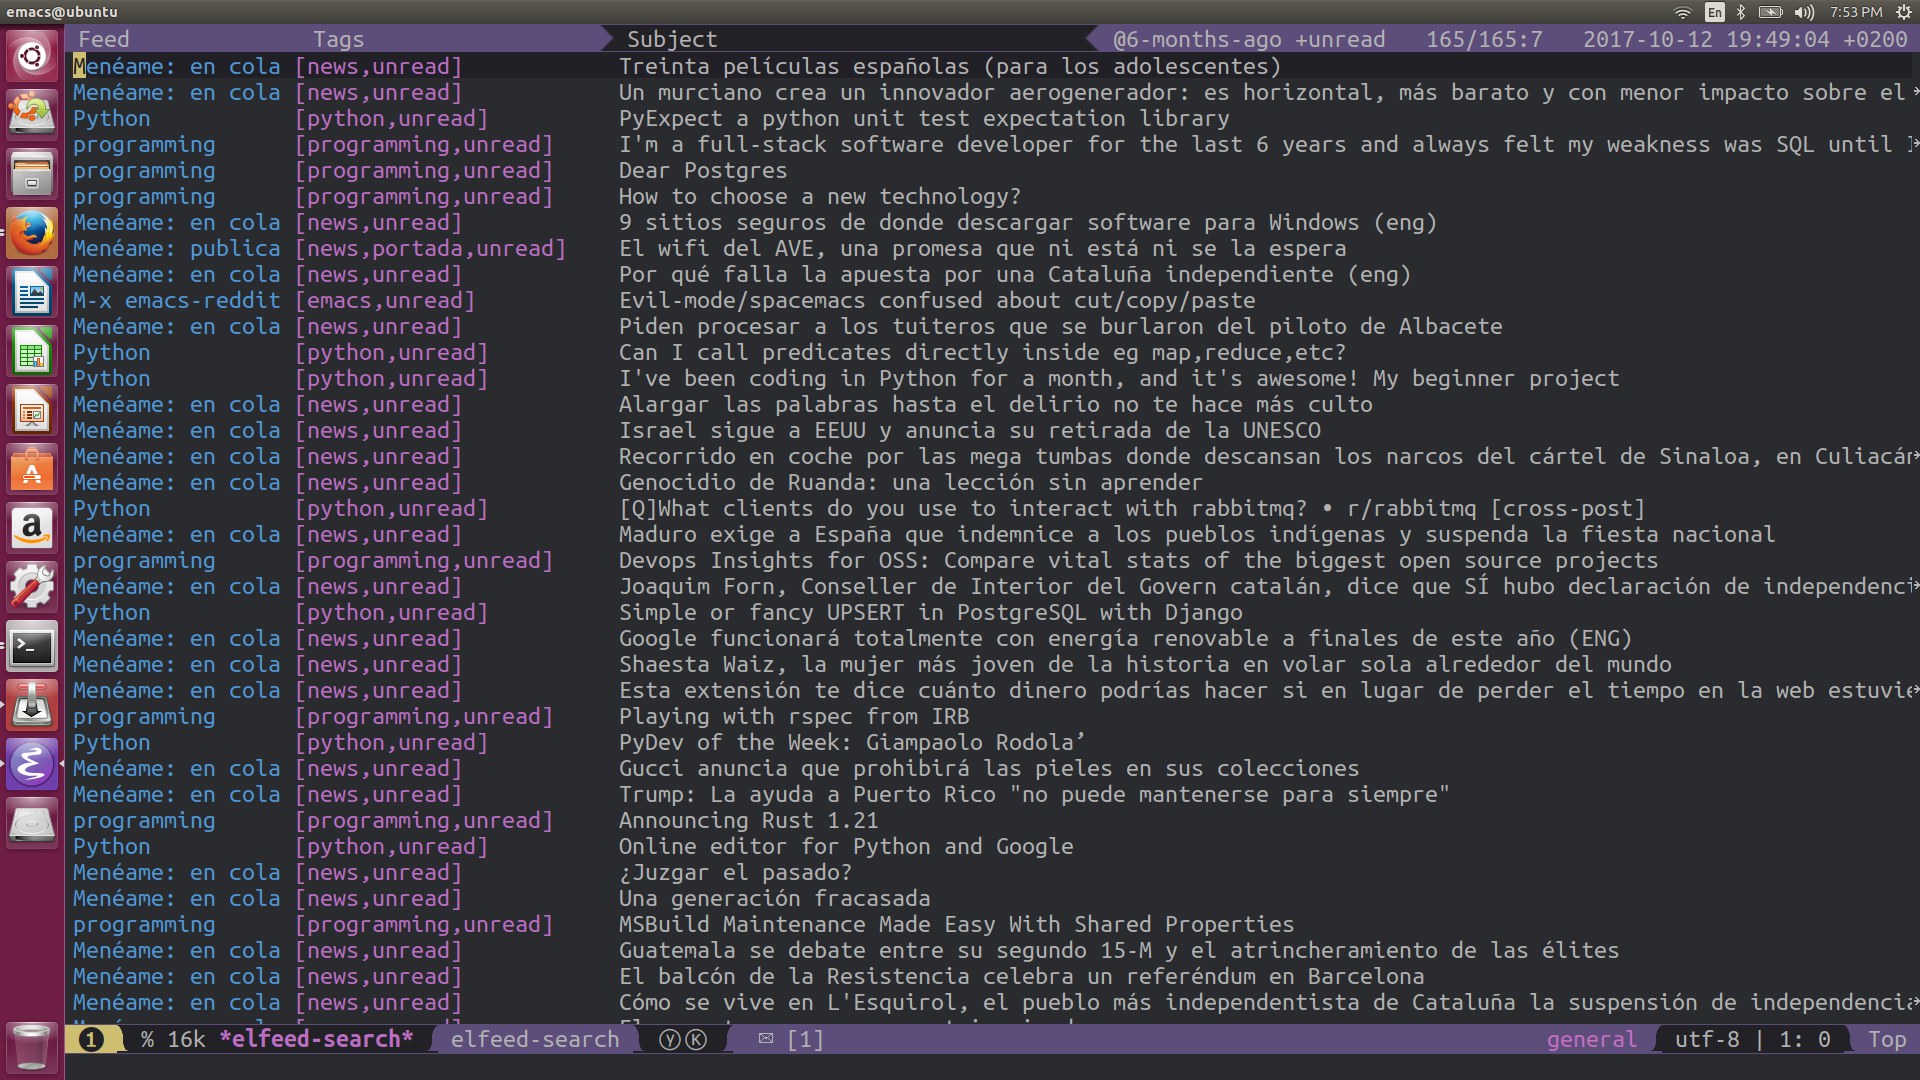
And selecting an article, it can be open, read and open each link by the default browser.
Several opinions about elfeed:
-
It is very simple to use.
-
The use of tags is very powerful, not only they received the tags from the category, and you can add a tag to an article.
-
The search filter is simple and very powerful, you can filter both for date and for tags.
-
The search filter can be kept as bookmark, so using C-x r b it can be seen the article using a particular filter.
To summary, elfeed has been a great discovery. If you use emacs, give it a try.
DONE Fill-more or the important of reading documentation
I love Emacs and the auto-fill more. When I work I use it always to make easier to read the text (with a small value, like 80 or 100). Then, if I have to copy to a Word Document (in collaboration with other people) or a text (like in the submission of a review) I simple set the fill-column to a large value (2000 or similar), with C-x f. Later, I copy all the text.
Until now I have suffered in silence a small problem in text-mode (not in org-mode). If you put
Text.

- Item 1.
- Item 2.
After the fill-mode, you have:
Text.

- Item 1 Item 2.
And to have in right you have to put a line between them:
Text.

- Item 1.

- Item 2.
(The line between Text and first item is also required).
I though it was something inevitable, but checking the documentation,
https://www.emacswiki.org/emacs/FillParagraph
I have known that with a simple line in elisp that behavior is fixed:
;; The original value is "\f\\|[      ]*$", so we add the bullets (-), (+), and (*).
;; There is no need for "^" as the regexp is matched at the beginning of line.
(setq paragraph-start "\f\\|[ \t]*$\\|[ \t]*[-+*] ")
I must check the available documentation more often :-).
Teaching
DONE Using Python for Business Intelligence
Two weeks ago I started my first teaching day, replacing a teacher that has still not gone to Ceuta (because the temporal contract was offered to many people, and all of them refuse it). Do not worry, they will have the material, I said to myself, naïvely.
However, my Phd. advisor, the coordinator of the course, has decided to replace the practice classes from Knime to Python using the different tools availables. The reason? Because the Python, with R, are very popular in Data Science. Also, in Python there are very good tools for data analysis (like numpy, pandas) or machine learning (scikit-learn, …). It seems a good idea, but I have not material, and I have only two days :-O.
Even more, I had still no access to the Moodle for the material of the course. So, after a very busy Saturday, I finished including a material, in http://github.com/dmolina/es%5Fintro%5Fpython, with interesting references and an install introduction.
Also, I use a very curious tool, https://gitpitch.com, that allow to create slides from a markdown file from the repository github, Slides using Pitch.
My final experience was:
-
Very few students, so it was very relaxed because you can solve the problems for each student. However, using the anaconda there is few problems (and the . In prevision of the big size of the anaconda distribution, my downloaded version was copied by USB Disk to students.
-
The jupyter notebook allow to test the python code without installing or learning an IDE (later they can install which they prefer, but for teaching you do not need any of them).
-
You have to prepare exercises, because if not, you talk and show and you can finished in few minutes a material that takes you many hours.
-
When you have only a weekend for preparing material, I must have already strong knowledge about the topic (fortunately, it was my case). If not, you will not be confident teaching it.
For the second day, I was preparing another slide for teaching pandas (with the most useful operations, by my experience), available as pdf format here: slides_pandas.pdf (In a future post, I will say as I prepare my slides using Emacs+Org-mode). Unfortunately, the new teacher was ready, and I have to finish my courses using python for BI.
DONE Introduction to CMake
In my last course, I decided to give a small introduction about CMake. The reason is that, although we teach them Make, the majority of students do not use them in their programs. In fact, many times they create a “makefile” program to pretend they are using “make”, but actually, it is a bash script. My intention is to teach them Cmake to encourage them to use an automatic tool for compiling, expecting they use it more, by its simpler syntax.
The english version is:

The spanish version is:

All the source code (in reveal.js, through org-reveal) are available at: https://github.com/dmolina/intro%5Fcmake
DONE About online teaching
These days we have to be enclosed in our houses by the coronavirus (COVID-19), so in my University (in Granada) as the others in Spain, we had to became in online teaching expert in a weekend.
For the courses we have following different approaches: Additional written material, several short videos about the materials, or conferences for giving the courses by video-conferences. All options have its advantages and drawbacks. However, because I like the feedback with the students (for instance, to make several examples in code about the concepts in my programming course), I have finally decided to give the course by video-conference. For recommendation of my university I use google meet, used also for the other teachers in the course. Personally, I prefer Jitsi, not only it is open source, but it also it is comparable in features to the google option, it is a great option.
A part of the teaching by video-conference, I have put all the slides in the Moodle of the courses (actually, it was previously there), and I will try to put some Quiz to allow students to have a better feedback about their knowledge.
The main problem has been to have a deaf student. The video-conference is not good, and I have spent several days trying several tools to automatic caption the voice, but in Spanish too many tools do not give a good performance (they have a lot of errors), finally the best option was Ability Connect, a tool from University of Alicante (Spain) for that. Unfortunately, sometimes it freezes.
Some people should think that I will have less work, but actually the situation have put me more work in teaching. It is good to learn new skills, but it takes a lot of time.
DONE My first Julia Package
For online teaching I use Moodle. I have a lot of experience using it (for more than 10 years). Unfortunately, the software could be improved a lot. My main complains are:
-
You can import the grades using an Excel file. However, you cannot import the comments. I like to give comment to explain the reason of the qualifications.
-
The Quiz is potent, but the creation of questions is very slow. Also, in my University several teachers have historically used another software. However, Moodle is unable to import these questions (in a different XML format).
In order to solve the second one, and in conjunction with my interest in Julia, I have created a package: MoodleQuestions. Not only it is able to export from the previous software, but it is also able to create the questions in a MoodleXML from a more intuitive file, in text file:
Input text file format
This package is able to read a text file. The format has been designed to be as simple and readable as possible.
 * Category 1

Question 1

- Option 1.1.
- Option 1.2.
+ Option 1.3.

 * Category 2

Question 2

+ Option 2.1.
- Option 2.2.
The sentences starting with * is a new category, with the name.
The sentences without *, +, or - are the text of the question. It is expected to be from only one line.
The sentences starting with - or + and the different answers for the previous question. The - means that the answer is false, and the + means that the sentence is the right answer.
The answers in the question are shuffle, except when one of the word of A, B, … is used. In these cases, the order of the options is maintained.
In my opinion, to create a text file with the questions in that format is a lot easier than using the web interface of Moodle.
My experience creating a package
I have experience creating a PyPI package in Python, and I only can say that creating a Julia package is a lot easier.
-
First, there are packages like PkgTemplates that create all the structure of the code.
-
Because in Julia you can add a non-official package adding the github url, you can use the package working (and share it) without have to register it.
-
The tests can be tested very easily with Tracis CI, for different Julia version and Operative System (it detected an error only in Windows). However, because Julia is not officially supported and the Sandbox implies to install all required packages for each time, the time in the test implies a lot of time, more than 1m30 in several versions. At least, it gives the tranquility of working in different julia versions.
-
The documentation can be done very easily with Documenter.jl, and it publish in Github Pages (the only problem was to define the DOCUMENTER_KEY environment variable, but the error was clear).
-
The Registration is was very simple. Originally, you had to do a Pull Request to the https://github.com/JuliaRegistries/General repository. However, nowadays you should use https://github.com/JuliaRegistries/Registrator.jl, that with a simple web interface it will do the PR for you (only the URL is required).
To summarise, the experience has been very positive. In my opinion, you are a lot more lost than in Python when you have to create your first setup.py, and it is easier to follow the good practices of Continous Integration with tests and Documentation. Also, there is a great presentation at https://www.youtube.com/watch?v=QVmU29rCjaA.
DONE My Julia journey
In this post I am going to tell my Julia journey.
I have read about Julia but not actually use it before version 0.7 just before 1.0. I work on Machine Learning and stochastic optimization (with evolutionary computation). In Machine Learning (and Deep Learning) I work nicely with Python (Scikit-learn and Keras/PyTorch). However, in optimization I usually did prototype in Python, and later have to translate to C++ for performance (well, not while the function evaluation takes too much). Now I starting using Julia for these algorithms (I prefer it a lot against Numpy). For ML I am actually testing options with Julia (MLJ.jl and Flux mainly).
My main problem is the lack of examples/tutorials in the documentation for several packages. Also, some missing functionality. I am going to explain it with an example. I did a small website in Julia to receive a file and transform it (for learning, I have experience in other technologies like Python/JS, ..) http://pradofacil.danimolina.net/. I did it using Frankling have to create my own website, it was nice. The server side I have two problems:
-
HTTP.jl is simple but not very complete, I have to create my own function to extract the POST parameters.
-
I wanted to have error messages in two different languages (English and Spanish), but the Gettext package did required Python, and I do not want to install it in the server only for that. So, I create my own package SimpleTranslation.jl to translate easy messages in a simple way.
Usually I create scripts, but in Julia the time required to load the packages make them slower than similar to Python. In order to reduce that problem I recently created DaemonMode.jl package, that got a great interest (even it was mentioned in JuliaCon 2020!).
The good and bad:
-
good: How easily is to create packages, and register it. The syntax, and many great packages: DataFrames, Plots, …
-
bad: documentation of several packages. There is the API, but learning to use them usually implies several tests.
To summarise, it is a great language. When you use it, sometimes to affort small problems due to a not too mature ecosystem, but the evolution is clearly to best. For sure I will use it!
OpenSource
DONE Firefox 3.5 and Mouseless
I have recently changed to Firefox 3.5, and it is awesome!!
The main improvements I have checked:
-
Better performance.
-
Reader mode, it is very useful to read without distractions, specially in mobile. Also, it is mouseless friendly, with the shortkey Ctrl+Alt+r.
-
Screenshots of a website, that you can share with anybody (not more excuses for my students for not showing me their web app in develop).
The bad thing is that many extensions are not valid anymore:
-
Zotero has changed to be a java application, and the great Zotelo (extension for Emacs) is not working anymore :-(.
-
Also, several extensions to improve the mouseless navigation stop working.
Fortunately, uBlock Origin is still working, and I have found Tridactyl, an extension with several nice features:
-
f and F allows you to open links (in same tab or new) identifying them with letters (in a very sensible way, my favourive way until now).
-
b is bookmarks, it allows you to go to another open tab.
-
s is search mode using the history, with tab you can go your favourite website more easily.
-
And ZZ close all firefox tabs, very useful for a person with Vim-background like me :-).
To summarize, if you do not like use the mouse for almost everything, and you want to browse more easily, try Tridactyl.
Año nuevo
! Bienvenidos !
En este año 2022 me he planteado usar mucho más el blog. Tras mucho pensar he llegado a la conclusión que para agilizarlo voy a empezar a escribir en Español.
Mi idea inicial era escribir en inglés pero eso hace que tenga mucha pereza en escribirlo.
Computer_Science
DONE Participation in IEEE Congress on Evolutionary Computation CEC'2018
Several weeks ago, I was at the the IEEE Conference on Evolutionary Computation (CEC'2018), and also at the National Conference on Artificial Intelligence, in Spain, website.
In https://speakerdeck.com/dmolina there are the slides of my presentations in the International Conference.
In particular, my works are the following:
- A new algorithm, SHADE-ILS which won the Large Scale Global Optimization, slides. You spanish readers, there is also a new version in Spanish.
In English <script async class=“speakerdeck-embed” data-id=“22192a5760234cb8984632450bec1b42” data-ratio=“1.33333333333333” src="//speakerdeck.com/assets/embed.js"></script>
In Spanish <script async class=“speakerdeck-embed” data-id=“91646e938fd34096b1613126a1828101” data-ratio=“1.33333333333333” src="//speakerdeck.com/assets/embed.js"></script>

- A new website for comparisons algorithms, https://tacolab.org, which is briefly described here in English, and also in Spanish.
PS: I will talk about the Tacolab website in next entries, because it is the results of many weeks of works.
DONE New LSGO Competition at the CEC'2019
I write because I am organizing the Large-Scale Global Optimization Competition at the IEEE Congress on Evolutionary Computation CEC'2019, with interesting news:
-
Source code for C++/Matlab/Java/Python.
-
The source code store during the run all required files with the results, you do not need to worry about that, we do it for you!
-
In python it is as simple as pip install cec2013lsgo to be able to run the experiments, in C++, and the source code and documentation is freely available.
-
The new site tacolab.org to compare your own proposals with existings ones, it do the tables, figures and comparisons for you (including statistical testing).
There is not excuse for not participating!
DONE Packages in Python for CEC'2019 100 Digit Competition
I usually design my evolutionary algorithms in Python (initially for prototyping, but I am too lazy for doing later a version in C/C++ or similar). However, unfortunately, the majority of people in my area work in Matlab 😭. Thus, sometimes I have to wrap the source code for the benchmarks in competition to python ☺️.
This is the story of the my new package at PyPi: https://pypi.org/project/cec2019comp100digit/.
This package is for being able to participate in the CEC'2019 100-Digit Challenge Competition, website here: http://www.ntu.edu.sg/home/epnsugan/index%5Ffiles/CEC2019/CEC2019.htm. That website was the source code in C/C++ and Matlab (using mex), but it was missing Python. This package solves it.
As usual, the complete source code is available at Github.
In the package Pypi page there is more documentation, but in the following I briefly describe the API:
The package is very simple to use. There is a package cec2019comp100digit with three functions:
-
init(fun_id, Dim) Init the function for the dimension selected.
-
eval(sol) Eval the solution, when sol is a numpy (or array) of dimension Dim.
-
end() Free resources.
Installation
It as simple as:
pip install cec2019comp100digit
Requirements:
- Python3.
- Numpy.
- Cython.
Process
-
For init the function.
from cec2019comp100digit import cec2019comp100digit bench = cec2019comp100digit bench.init(3, 10) # Init function 3 with dimension 10 -
To create one or several solutions to eval
It can be used both numpy and/or array (but only numpy has been actually tested).
import numpy as np sol = np.random.rand(10) -
Evaluate the solution
It is as simple as:
fit = bench.eval(sol) -
Finally, for free the resources
bench.end()
You can also use it for participate in the competition.
I would like to take this opportunity to remind you that I too am organising another competition, you do not any excuse 😄.
DONE New LSGO Competition at the WCCI'2020

I write because I am organizing the Large-Scale Global Optimization Competition at the IEEE Congress on Evolutionary Computation WCCI'2020, with interesting news:
-
I am not more the Chair of the IEEE CIS Task Force on Large Scale Global Optimization, but I organize in collaboration with them.
-
The new site tacolab.org to compare your own proposals with existings ones, it do the tables, figures and comparisons for you (including statistical testing). Also, it includes data of all previous winners!
-
The deadline is 30 January, there is still time.
So, there is not excuse for not participating, I wait you in Glasglow!
)
Daniel Molina
Professor of Artificial Intelligence
My research interests include distributed robotics, mobile computing and programmable matter.